Apple confirmed yesterday it had sold three million iPads since launch and now we have another testament to the tablet’s incredible success. Though it was released less than a week ago on Friday, March 16th, online ad agency Chitika claims that the new iPad already accounts for over 5 percent of iPad traffic in the United States.
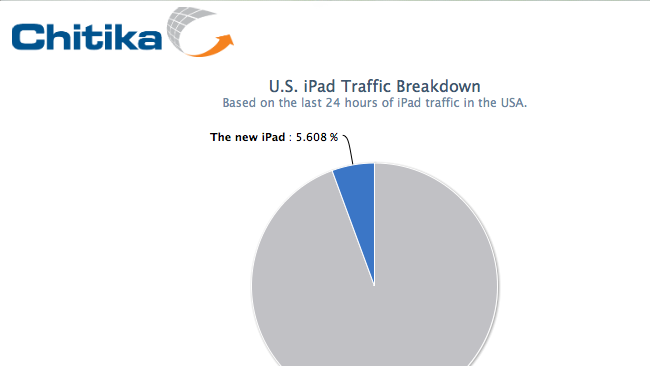
Chitika set up a web page where you can monitor iPad traffic live via a pie chart that separates the market share between the new third-generation iPad and the previous generations combined. Based on the last 24 hours of Internet traffic in the US, the new iPad accounted for 5.608 percent, leaving the original iPad and iPad 2 with 94.392 percent. Chitika’s iPad tracker also shows data for the adoption rate per hour and adoption per state. For example, California is the state with the highest adoption rate — 6.34 percent of all iPads in use are third-generation iPads. Connecticut is in second place with 6.131 percent.
Chitika says it determines if an iPad is being used and which model it is by three key factors: user agent, origin, and display resolution. All iPads carry a specific user agent, which confirms that the device is in fact an iPad. The origin is easily found by geolocation technology. Pixel density is key in figuring out whether it’s a new iPad or an older model — if Chitika picks up that the device has a 2048 x 1536 resolution display, it’s obviously a new iPad with a retina display. Older iPads have a 1024 x 768 resolution.
While Chitika can’t measure the exact market share of each iPad, it does serve ad impressions across millions of websites. Using the information gathered from these ads, it’s able to make a fairly accurate market share prediction.