Opera Mediaworks released its Q2 State of Mobile Advertising report, briefing the industry on mobile monetization and advertising trends that unfolded during the period. Here are the highlights:
- iPhone is still a clear revenue winner, generating 36.4% of revenue compared to Android’s 27.8%. Additionally, iOS also accounts for 43.8% of impressions though Samsung’s dominance of the Android market (58.5%) makes it a strong contender.
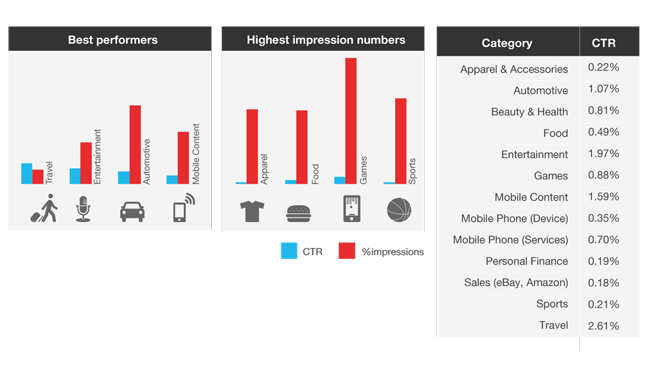
- Baseball season kickoff makes Sports the No. 1 revenue generator for the quarter. Though Sports only commands a 6.5% share of the revenue generated across all categories, this quarter publishers in this category received a disproportionate 22.2% of revenue from their mobile apps and sites. Music, Video & Media again received the highest volume of impressions at 22.4%.
- 3 out of every 4 dollars of all mobile transactions occur in the United States.
- Based on data on the Opera Mediaworks platform from the past year, advertiser budgets may taper off in January, as the holiday retail season dissipates, but mobile use continues well into the month as users play with their new devices. Other observations include a mini-surge in August and a notable spring break season (March/April), with traffic comparable to the more commonly known pre-holiday jump in November.
- Rich media in-app campaigns outperform banners and mobile web. Brand advertisers shifting their mobile ad dollars to rich media creative campaigns get an average click-through rate of 1.53%.
And in case you wonder, these insights are derived from Opera’s large trove of mobile ad data, pulled from the platform that serves 60+ billion ad impressions per month via 13,000 mobile sites and apps, reaching 400 million consumers a month. You can get additional details from here.